

This isn’t fancy. The idea of a 50 yr mortgage should scare us.

This is rough numbers. I am not a financial expert. But I can identify the huge potential for generational debt in the idea being tossed out there. That a 50 yr mortgage will encourage young people to buy homes.
I asked AI to provide me with the AVERAGE mortgage interest rate since the inception of the 30 year mortgage. That value (according to AI) was 7.5%. Seems reasonable enough to provide us with working information for the following:
📈 Historical 30-Year Fixed Mortgage Rate Trends
Approximate yearly averages:
- 1950s: ~4%–5%
- 1960s: ~5%–6%
- 1970s: ~7%–9%
- 1980s: peaked around 16% (average ~12%)
- 1990s: ~8%
- 2000s: ~6%
- 2010s: ~4%
- 2020–2021: record lows ~3%
- 2022–2024: ~6–7%
🧮 Weighted Average Estimate (1950–2025)
If we roughly weight those decades by their duration and rate range, the overall average 30-year fixed mortgage rate over the entire period comes out to around:
≈ 7.5% average since inception
That’s a blended figure — the “typical” long-term cost of a 30-year mortgage across all those market cycles.
🧮 The Formula
(If there is a better formula to use, please let me know and I will plug it in.)
M=P×r(1+r)n(1+r)n−1M = P \times \frac{r(1+r)^n}{(1+r)^n – 1}M=P×(1+r)n−1r(1+r)n
where
- P=435,000P = 435,000P=435,000
- r=7.5%÷12=0.00625r = 7.5\% ÷ 12 = 0.00625r=7.5%÷12=0.00625
- n=360n = 360n=360 (30 years) or 600600600 (50 years)
30-Year Mortgage @ 7.5%
- n=360n = 360n=360
- M≈435,000×0.00625(1.00625)360(1.00625)360−1M ≈ 435,000 × \frac{0.00625(1.00625)^{360}}{(1.00625)^{360} – 1}M≈435,000×(1.00625)360−10.00625(1.00625)360
- ✅ Monthly payment ≈ $3,040
- Total cost = $3,040 × 360 = $1,094,400
- Interest paid = $1,094,400 – $435,000 = $659,400
50-Year Mortgage @ 7.5%
- n=600n = 600n=600
- M≈435,000×0.00625(1.00625)600(1.00625)600−1M ≈ 435,000 × \frac{0.00625(1.00625)^{600}}{(1.00625)^{600} – 1}M≈435,000×(1.00625)600−10.00625(1.00625)600
- ✅ Monthly payment ≈ $2,990
- Total cost = $2,990 × 600 = $1,794,000
- Interest paid = $1,794,000 – $435,000 = $1,359,000
✅ Comparison Summary
| Term | Rate | Monthly Payment | Total Cost | Total Interest |
|---|---|---|---|---|
| 30-Year | 7.5% | ≈ $3,040 | ≈ $1,094,400 | ≈ $659,400 |
| 50-Year | 7.5% | ≈ $2,990 | ≈ $1,794,000 | ≈ $1,359,000 |
🧩 Key Takeaways
- The monthly difference is only ~$50, but
- The extra 20 years adds roughly $700,000 more in interest.
- You’d pay 2.4× the original loan over 50 years.
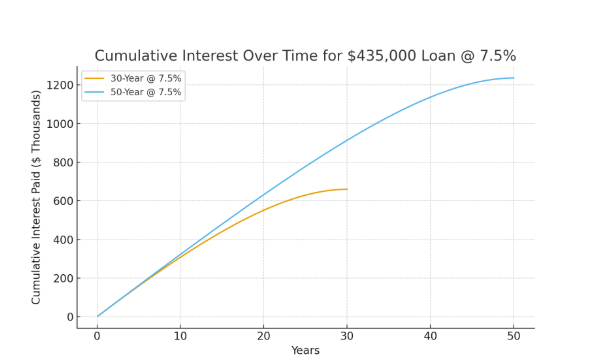
That graph should scare you. Here’s the visual comparison:
- The orange line (30-year) shows cumulative interest tapering off around $660,000 after 30 years.
- The blue line (50-year) keeps climbing to about $1.36 million in total interest.
- Notice that after 30 years, the 50-year loan still owes roughly half the principal, yet it’s already paid nearly as much interest as the full 30-year loan.
That curve clearly shows how extending the term adds decades of interest with minimal monthly savings.
Now, add in your taxes and insurance costs. Both of which are rising. We are no longer talking about home ownership. We are talking about renting from the bank, with all of the onus falling on you.