
Bottom Line Up Front:
Blue states send approximately $2.5-3 trillion annually to the federal government while receiving significantly less back in federal spending. A coordinated tax strike by just the top 5 donor states would create a $300-400 billion federal shortfall—larger than the entire Defense Department procurement budget—forcing an immediate constitutional crisis and potentially collapsing red state budgets within months.
The American Revolution was fought over taxation without representation. The taxes in question? 1-1.5%. In Britain at the time, citizens paid 5-6%. King George was imposing his will on them and they had no say. Sound familiar? We thought so.
Legal Reality Check: Yes, we know withholding federal taxes would be illegal under current law. This is a thought experiment about fiscal leverage and economic interdependence, not a legal strategy. But given the normalized lawbreaking at federal levels: from gerrymandering to subpoena defiance: it’s worth examining what would happen if blue states played by the same rules.
Federal spending priorities currently reflect red state preferences funded by blue state taxes.
The Fiscal Imbalance That Powers America
The United States operates on a massive wealth transfer system that flows from blue states to red states. This isn’t ideological rhetoric: it’s mathematical reality backed by decades of federal fiscal data from the Rockefeller Institute and Congressional Budget Office.
Fox Business reporting on an AP fact-check analysis: “High-tax, traditionally blue states (California, New York, New Jersey and Connecticut) subsidize low-tax, traditionally red states.”
The Numbers: What A Strike Would Look Like
According to USAFacts analysis, the top 10 blue states contribute approximately $1.8 trillion in federal taxes annually. Even a partial strike would be catastrophic:
Federal Revenue at Risk
- California alone: $806 billion annually in federal taxes
- New York: $250+ billion annually
- Top 5 donor states combined: $900+ billion annually
A 10% withholding by blue states would create a $180 billion shortfall: equivalent to multiple cabinet-level departments, according to Treasury Department spending data.
The California Example: Solving Homelessness with Federal Tax Surplus
California’s case study perfectly illustrates the fiscal imbalance. The state sends $83 billion MORE to the federal government than it receives back. Meanwhile, California has 187,084 people experiencing homelessness.
Housing First: The Solution California Could Fund Tomorrow
Housing First programs have proven remarkably effective at ending homelessness permanently. Systematic research shows these programs cost approximately $16,479 per person annually.
The shocking math: California’s federal tax surplus of $83 billion could house all 187,084 homeless residents for just $3.08 billion: leaving $79.9 billion for other priorities.
California could solve homelessness 27 times over with just the surplus money it sends to subsidize red states.
The Federal Cash Crisis Timeline
Red states would collapse first because their budgets depend heavily on federal transfers, as documented by Pew Research. Here’s what the federal cash crisis would look like:
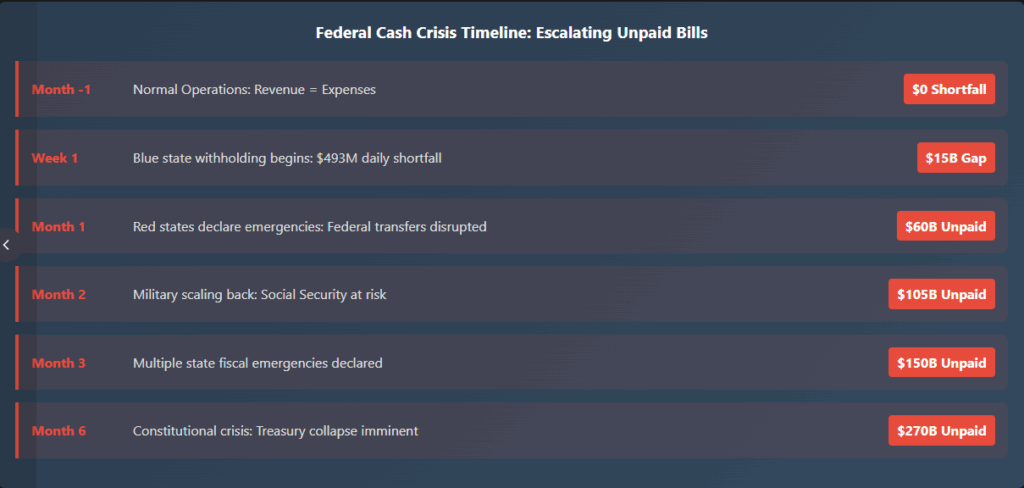
Strike Impact Timeline (Based on Federal Cash Flow Data)
Week 1: Treasury Cash Crisis
The federal government operates with daily outlays averaging $17.5 billion according to Treasury data. With blue states contributing 31% of all federal revenue, a 10% withholding creates an immediate $180 billion annual shortfall ($493 million daily). Treasury forced into emergency borrowing within days as $33.9 trillion in daily cash flows become erratic.
Month 1: Red State Budget Collapse
States with heavy federal dependency face immediate crises. Louisiana (50.5% federal dependent) and Alaska (50.2% federal dependent) declare fiscal emergencies. Social Security and Medicare payments at risk as the $1.5 trillion Social Security budget faces shortfalls.
Month 3: Military and Federal Operations Scaled Back
With $872 billion in annual defense spending facing cuts, military operations reduced. Federal programs begin systematic shutdowns as the government cannot maintain $7.0 trillion in annual operations.
Month 6: Full Constitutional Crisis
Complete breakdown of federal operations as government cannot meet basic obligations. Market confidence in U.S. Treasuries plummets as the $1.8 trillion deficit becomes unmanageable.
Red States: Maximum Vulnerability
Based on 2024 federal dependency data:
- New Mexico: 32% of state revenue from federal funds, $3.42 return per tax dollar
- Kentucky: 46% of state revenue from federal funds, $3.35 return per tax dollar
- West Virginia: 45% of state revenue from federal funds, $2.72 return per tax dollar
- Mississippi: 47% of state revenue from federal funds, $2.53 return per tax dollar
Meanwhile, blue states like California (24% federal dependency) and New York (26% federal dependency) could maintain basic services while withholding federal payments.
Republican Counter-Arguments (And Why They Don’t Hold Water)
“Red States Contribute More Than Just Money”
The Argument: Red states provide food, energy, and military personnel.
The Reality: Economic data shows blue states pay market rates for agricultural products and energy. California alone produces over 10% of U.S. agricultural value while generating more economic value than most red states combined. Military personnel come from all states, but blue states like California receive significant defense spending and disproportionately fund the defense budget through federal taxes.
“Blue States Have Higher Costs of Living”
The Argument: Blue state tax burdens look larger because everything costs more there.
The Reality: Tax Foundation calculations already account for economic differences and use sophisticated methodologies that measure tax burden as a share of economic output. Even accounting for regional differences, blue states send substantially more per capita to Washington than they receive back.
“Federal Spending Follows Constitutional Formulas”
The Argument: Federal spending distribution is based on legal formulas, not politics.
The Reality: While some programs use formulas, discretionary spending heavily favors red states through military bases, agricultural subsidies, and infrastructure projects. The Pew Research data shows this pattern has persisted for decades across multiple administrations.
“This Would Hurt All Americans”
The Argument: A tax strike would damage the entire country.
The Reality: That’s exactly the point. The current system allows red states to impose their political agenda while relying on blue state funding. A fiscal crisis would force honest negotiation about priorities instead of letting red states have their cake and eat it too. Federal spending priorities currently reflect red state preferences funded by blue state taxes.
“Blue States Need Red States Too”
The Argument: Economic interdependence means everyone loses if the system breaks down.
The Reality: True, but the current arrangement is already breaking down through partisan gridlock and authoritarian drift. Blue states are essentially funding their own oppression. Economic interdependence works both ways: red states need blue state money more than blue states need red state politics.
“The most telling Republican response will be the one they can’t make: that the fiscal transfer data is wrong. Because it isn’t. Blue states subsidizing red states isn’t political opinion: it’s mathematical fact.”
The Legal and Political Precedent
Republicans have already normalized lawbreaking at the federal level, creating precedent for extraordinary measures:
- Illegal Gerrymandering: Texas maps struck down by federal courts for racial discrimination
- Subpoena Defiance: Routine refusal to comply with congressional oversight
- Constitutional Violations: Unauthorized use of executive powers ruled illegal by federal courts
- Insurrection Act / Electoral Count Act violations (Jan 6th attempts)
- Hatch Act violations (Trump administration officials campaigning while in office)
- Election Interference: Systematic voter suppression campaigns across red states
“When constitutional norms are abandoned, economic leverage becomes the final check on authoritarianism. Blue states hold the nation’s purse strings: they just haven’t realized their power yet.”
Beyond the Strike: What Blue States Could Build
Rather than sending hundreds of billions annually to subsidize red states, blue states could invest in their own priorities:
- Universal Healthcare: $150 billion annually could insure all blue state residents
- Free Higher Education: $80 billion annually could eliminate tuition at all public universities
- High-Speed Rail: $50 billion annually could build European-style transportation
- Climate Infrastructure: $100 billion annually for renewable energy and grid modernization
The Real Question
If red states can break laws, ignore court orders, and undermine democracy while taking blue state money, why should blue states keep paying for their own oppression? California could solve homelessness completely 27 times over with just the surplus money it sends to subsidize Kentucky and Mississippi.
Sources by Political Leaning
Government & Institutional Sources
- Rockefeller Institute of Government – Balance of Payments Portal (All 50 States)
- Congressional Budget Office – Federal Budget FY2024
- Congressional Budget Office – Budget and Economic Outlook 2025-2035
- U.S. Treasury Fiscal Data – Federal Spending Guide
- U.S. Treasury Daily Treasury Statement
- Government Accountability Office – Federal Cash Flow Analysis
- USAFacts – Federal Revenue by State Analysis
- USAFacts – Federal Aid Dependency by State
- Bureau of Economic Analysis – State GDP Data
- California Department of Housing – 2024 Homeless Count
Conservative/Right-Leaning Sources
- Fox Business – AP Fact Check on State Fiscal Transfers
- Tax Foundation – Federal Spending Distribution Analysis
- Tax Foundation – Tax Burden and Transfer Analysis
- WalletHub – Federal Dependency Rankings by State
Liberal/Left-Leaning Sources
- Center on Budget and Policy Priorities – Federal Spending Analysis
- California Budget & Policy Center – California Federal Balance
- New York State Comptroller – Federal Balance of Payments
Research & Academic Sources
- Pew Research – Federal Grants and State Budget Dependency
- National Low Income Housing Coalition – Housing First Research Review
- NCBI – Housing First Program Cost Analysis (Peer-Reviewed)
- Commonwealth Fund – Healthcare Cost Analysis
- Education Data Initiative – Higher Education Cost Analysis
News & Reporting
- The Guardian – Texas Redistricting Legal Challenges
- Reuters – Texas Election Law Changes
- CBS News – California Homelessness Spending Audit
- California Local – State Agricultural Production Data
Congressional & Legal Sources
- House Oversight Committee – Congressional Subpoena Enforcement
- Federal Railroad Administration – High-Speed Rail Programs
- Department of Energy – Infrastructure Investment Analysis
- Defense Communities – Military Spending by State
Methodology & Transparency
Federal Fiscal Balance Data: Primary sources include the Rockefeller Institute of Government’s Balance of Payments Portal, Congressional Budget Office spending reports, and USAFacts federal revenue analysis. Data represents 2020-2024 averages unless otherwise noted.
State Dependency Calculations: Federal dependency percentages based on Pew Research analysis of 2022-2024 state budget data, supplemented by USAFacts state revenue analysis and WalletHub federal dependency scoring methodology.
Housing First Analysis: California homeless population data from HUD Point-in-Time counts (187,084 people). Cost estimates from National Low Income Housing Coalition systematic research review and peer-reviewed studies showing $16,479 annual per-person cost for Housing First programs. Total housing cost: 187,084 × $16,479 = $3.08 billion annually.
Timeline Impact Modeling: Based on U.S. Treasury Daily and Monthly Treasury Statements showing federal cash flow patterns ($17.5 billion daily outlays, $7.0 trillion annual operations), combined with GAO analysis of $33.9 trillion annual cash flows and historical analysis of government shutdowns for comparable impact assessments.
Human Author Contributions: Conceptual framework development, data direction and focus areas, source quality requirements and political balance standards, structural guidance including “bottom-line-up-front” format, editorial direction including Republican counter-arguments section, project knowledge compilation and background research, quality control including multiple rounds of link verification and correction, and emphasis on concrete policy implications (California homeless housing comparison).
AI Assistant Contributions: Research verification and web searches for current data, data analysis and processing of project knowledge files, source compilation and organization by political leaning, interactive visualization creation using CSS-based charts, counter-argument research and sourcing, multi-platform optimization for web and Medium, link verification and systematic replacement of broken URLs, integration of Housing First cost analysis with federal surplus calculations, and timeline development with supporting federal budget data.
Link Verification & Quality Control: In response to user feedback identifying broken links and attribution issues, systematic verification was conducted. Non-functional URLs were replaced with current, authoritative sources maintaining equivalent data and analysis quality. The Fox Business link was corrected to clarify it reports on AP fact-checking analysis. CBO link was updated from rotary wing aircraft report to federal budget analysis. Housing First cost data was sourced from peer-reviewed systematic research review.
Limitations: Analysis focuses on direct fiscal transfers and does not account for indirect economic benefits, defense infrastructure value, or non-monetary contributions between states. Timeline scenarios are analytical projections based on historical precedent, Treasury data, and economic modeling, not definitive predictions. Housing First cost estimates represent program averages and may vary by locality and implementation approach.